What are the Correlation and Coefficient?
The correlation coefficient is a statistical measure that calculates the strength of the relationship between the relative movements of two variables.
We use it to measure both the strength and direction of a linear relationship between two variables the values range between -1.0 and 1.0.
A calculated number greater than 1.0 or less than -1.0 means that there was an error in the correlation measurement.
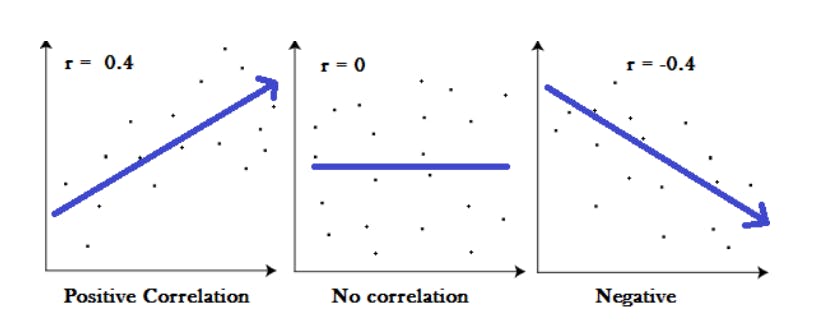
A correlation of -1.0 shows a perfect negative correlation, while a correlation of 1.0 shows a perfect positive correlation.
Correlation coefficient formulas are used to find how strong a relationship is between data.
The formulas return a value between -1 and 1, where:
1 indicates a strong positive relationship.
-1 indicates a strong negative relationship.
A result of zero indicates no relationship at all.
Meaning:
- A correlation coefficient of 1 means that for every positive increase in one variable, there is a positive increase in a fixed proportion in the other.
For example, shoe sizes go up in (almost) perfect correlation with foot length.
A correlation coefficient of -1 means that for every positive increase in one variable, there is a negative decrease of a fixed proportion in the other.
For example, the amount of gas in a tank decreases (almost) perfectly in correlation with speed.
Zero means that for every increase, there isn’t a positive or negative increase. The two just aren’t related.
What is a Negative Correlation?
A negative correlation is a relationship between two variables in which one variable increases as the other decreases, and vice versa.
In statistics, a perfect negative correlation is represented by the value -1.
A negative correlation or inverse correlation is a relationship between two variables whereby they move in opposite directions.
If variables X and Y have a negative correlation (or are negatively correlated), as X increases in value, Y will decrease; similarly, if X decreases in value, Y will increase.
What Is Positive Correlation?
A positive correlation is a relationship between two variables in which both variables move in tandem—that is, in the same direction.
- A positive correlation exists when one variable decreases as the other variable decreases or one variable increases while the other increases.
We use the correlation coefficient to measure the strength and direction of the linear relationship between two numerical variables X and Y.
The correlation coefficient for a sample of data is denoted by r.
Pearson Correlation Coefficient:
Pearson is the most widely used correlation coefficient. Pearson correlation measures the linear association between continuous variables.
In other words, this coefficient quantifies the degree to which a relationship between two variables can be described by a line.
The formula developed by Karl Pearson over 120 years ago is still the most widely used today.
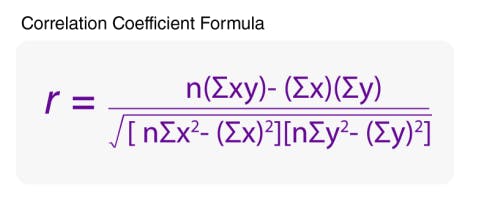
The formula for the correlation (r) is;
Where n is the number of pairs of data;
These are the sample means of all the x-values and all the y-values, respectively; and sx and sy are the sample standard deviations of all the x- and y-values, respectively.
Find the mean of all the x-values and the mean of all y-values.
Find the standard deviation of all the x-values (call it sx) and the standard deviation of all the y-values (call it sy). For example, to find sx, you would use the following equation:
For each of the n pairs (x, y) in the data set, take
Add up the n results from Step 3.
Divide the sum by sx ∗ sy.
Divide the result by n – 1, where n is the number of (x, y) pairs. (It’s the same as multiplying by 1 over n – 1.) This gives you the correlation, r.


